

The Ethereum to Bitcoin ratio has just broken a key short-term barrier. And as Ethereum’s price is closely watched as a barometer of where the wider speculation feel is bar BTC, the market is paying attention.
The ETH/BTC is a good pair to take note of and is used in a similar method to the gold/silver ratio as a marker of the relative value of one metal to another. Whilst many had discounted that metric for many years, the recent silver shortages and the dislocation between spot and physical delivery prices are demonstrating. Anyway, enough of the digression!
Reasons for Ethereum to Rise
One catalyst could been seen to be the stopping of Quantitative Tightening by the Federal Reserve on the 2nd of December, more rate cuts and a far more dovish Fed chair pick. However, against this back drop is the rising yields of Japanese long-duration bonds. Therefore, the picture from the macro liquidity angle is looking decidedly more mixed.
Another reason for the jump is the recent Fusaka upgrade on the Ethereum network, reducing latency and fees as the network gains a higher degree of efficiency.
Or it could simply be that BTC profits are being rotated into ETH.
What Does Alt Season Mean and How Long Does It Last?
When the top 100 coins/tokens – bar Bitcoin – are moving up faster than BTC, we can definitively say it is alt season…seems to be the official line.
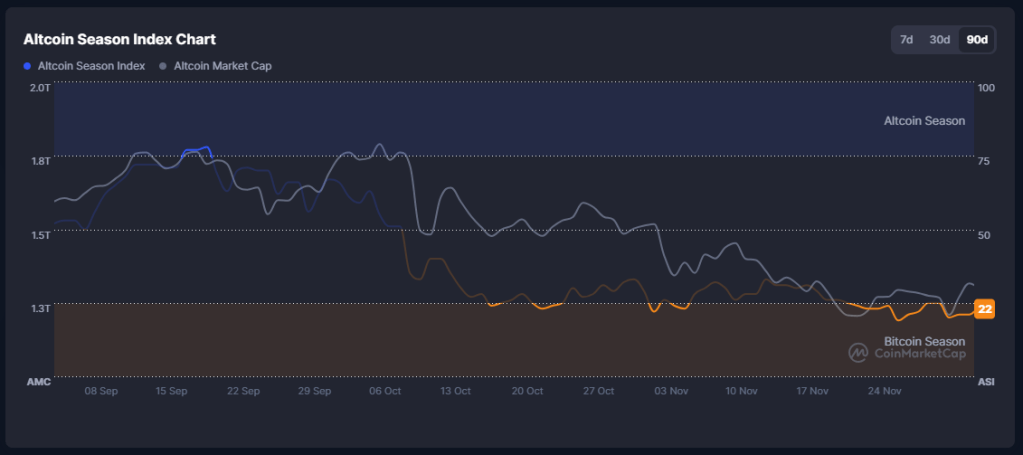
The length of an altcoin season can considerably vary, from months (when considering a ‘true’ or historically-viewed season within the BTC boom/bust cycle) to just a few weeks (if one goes by the definition of “When the top 100 coins/tokens – bar Bitcoin – are moving up faster than BTC, we can definitively say it is alt season”).
Many trackers of alt season show multiple seasons during a single boom and bust of Bitcoin’s cycle, as seen below (with BTC making its last lowest low in December 2022). However, many in the crypto industry consider a true altcoin season to peak after Bitcoin has peaked, usually trailing it by around a month.

The ETH/BTC Ratio’s Key Barrier Broken
The Ethereum to Bitcoin ratio is currently at 0.034.
The pair reached its peak in June 2017 at 0.155, and since then has been steadily falling, reaching a notable level of 0.888 in December 2021.
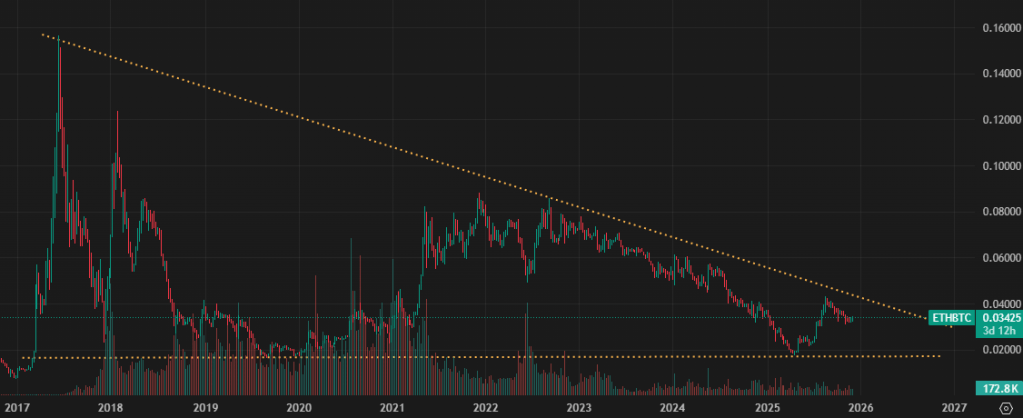
Taking a closer look below, we can see that price has been languishing at a level of the 0.382 Fibonacci retracement level – the key level for your run-of-the-mill bull flag – which could mean the ratio rises to 0.056, possibly around late-March if the second leg follows the first in terms of timing.

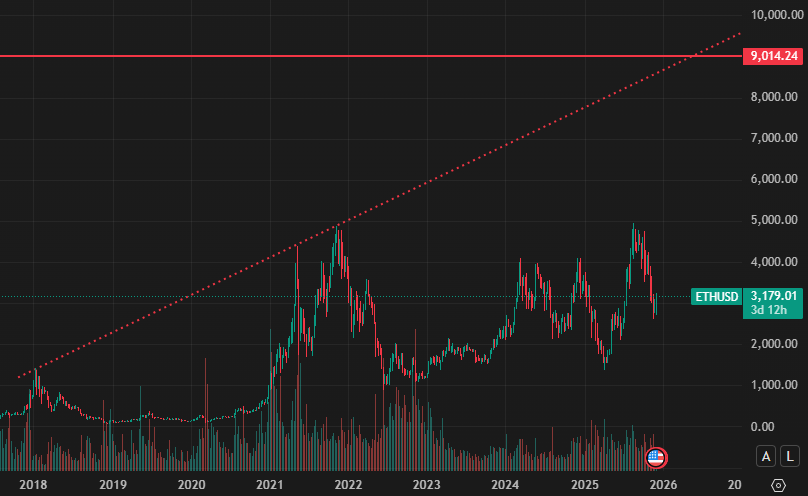
If it does rise to 0.056, it sets up a route all the way to 0.166. If BTC was at ~$40,000, ETH would be $6,640, BTC at $60k would put ETH at $9,960 and BTC at $80k would put ETH at $13,280. Although $9,000 would be in line with the long-term Ethereum top resistance line, as seen below.
Price Discoveries Disclosure: Not financial advice. No guidance is provided for any particular investor, asset prices can fall as well as rise. Price Discoveries is not a licensed securities dealer, broker, investment bank or advisor.
